Introduction
If we want to show any report in excel format in page level with the different font of column values we can use this component script to achieve the scenario.
Steps To Follow
Step1:
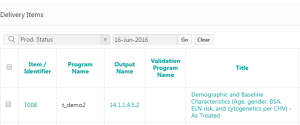
Create a interactive report that we need to show in excel format
Step2:
In a report definition type the query base on the select list and dense_rank () method.
Step2:
You can use the HTML tags in the select list to show the name in different format that we need
Excel Format Interactive Report Standard
SELECT (‘<b>’ || col1 || ‘<b>’) “xxx”,
(‘<b>’ || col2 || ‘<b>’) “yyy”,
(‘<u>’ || col3 || ‘<u>’) “yyy”,
(‘<i>’ || col4 || ‘<i>’) “yyy”,. . .
FROM (SELECT DECODE (rk, 1, col1, ”) “xxx”,
DECODE (rk, 1, col2 || ‘%’, ”) “yyy”, col3, col4, col5,col6
FROM
(SELECT col1, col2,
Col3,col4,col5,col6
DENSE_RANK () OVER (PARTITION BY col6 ORDER BY tablename1.ROWID) rk
FROM t1, t2
WHERE t1.col1=t2.col1
AND condition1
AND condition2
AND condition3
AND condition4
));
Step3:
Create a query based on this and modify the column name and enter the query in the report region.
Step4:
After Entering the query go to Interactive report à Report Attributes change the Display Text As à Standard Report Column
Step5:
Now we can able to see the report in excel format.
Coding Explanation
SELECT (‘<b>’ || col1 || ‘<b>’) “xxx”, (This can used to show the column values in bold format)
(‘<b>’ || col2 || ‘<b>’) “yyy”,
(‘<u>’ || col3 || ‘<u>’) “yyy”, (This tag will show the column values in underline format)
(‘<i>’ || col4 || ‘<i>’) “yyy”,(This tag will show the column values in italic format)
. . .
è We can add column based on the design here
FROM (SELECT DECODE (rk, 1, col1, ”) “xxx”,
DECODE (rk, 1, col2 || ‘%’, ”) “yyy”, col3, col4, col5,col6
FROM
è This Decode option will used to restrict the same reputation of record and show them only once
(SELECT col1, col2,
Col3,col4,col5,col6
DENSE_RANK () OVER (PARTITION BY col6 ORDER BY tablename1.ROWID) rk
FROM t1, t2
WHERE t1.col1=t2.col1
AND condition1
AND condition2
AND condition3
AND condition4
));
Call To Action
For Oracle apex development and customization please contact us.Our company website https://doyensys.com/
Conclusion
By following above steps we can show any report in excel format in page level with the different font of column values.